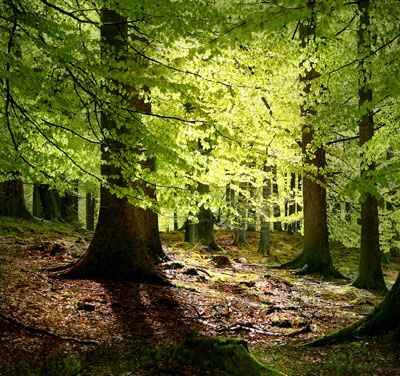
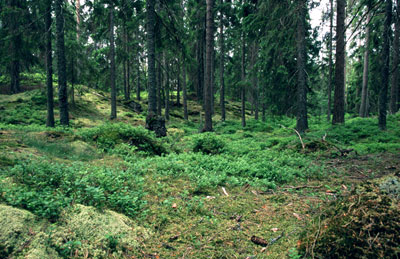
The potential vegetation at a given place (the vegetation that would develop if no human actions were performed) is determined by abiotic factors, in particular climatic and edaphic (soil) factors.
Each plant species has physiological characteristics that allow it to live in a certain range of temperature, moisture, acidity, etc.
It is thus necessary to know the climatic requirements of the plant species that were present during the different investigated periods to reconstruct the past climates.
Such an analysis may be based on climate-indicator plant functional types, i.e. groups of taxa that can live in the same temperature and moisture ranges, of which the present limits are known.
Functional types and climate : basic principle
The climatic requirements of a functional type may be determined on the basis of 3 major climatic factors :
climatic factor |
measurable parameter |
mechanisms |
| winter cold | temperature of the coldest month (=tc) (°C) | - tolerance to extreme temperatures (tc min) |
| heat during growing season | accumulated growing-season warmth (growing-day degrees, GDD) = sum of the differences between daily maximum temperatures and a threshold (often +5°C) | heat requirements for seasonal development |
| moisture availability | ratio of actual to potential evapotranspiration (= α) | tolerance to drought, which is an expression of soil moisture |
Main plant functional types in Europe
A graphical representation of the functional types and their climatic limits would require a three-dimensional diagram (cf. 3 parameters).
The diagram adopted here is a two-dimensional simplification with the following logic :
-
the functional types are ordered along the x-axis (without values); a group is considered "warmer" than the preceding if one minimum temperature or one heat requirement is higher than that of the preceding;
-
the moisture, estimated by the parameter, is represented along the y-axis. This allows to distinguish forests (where precipitation meets >65% of evaporation demand) and treeless or sparsely treed vegetations.

Interpretation of the diagram
Each climatic domain, defined by lower and/or upper limits of moisture, temperature and heat, corresponds to the optimum conditions for a group of taxa. Some taxa may survive in a broad range of conditions, and juxtapositions may occur (i.e. presence of taxa from different functional types in the same landscape).
In order to determine which functional type was dominant at a given period, on the basis of the taxa encountered in the sample, the relative importance of the taxa must be taken into account. Example: the deciduous boreal forest is dominated by birches (Betula). But birches are also present in temperate forests among other trees. If Betula is overwhelmingly dominant in a reconstructed landscape, it probably belongs to a boreal forest; if Betula is present, but not dominant, among various other taxa, then the landscape is dominated by another forest type.
Note.
Some taxa have a very broad climatic amplitude: they do not belong to a single functional type and do not provide accurate information about the climate (e.g. Pinus, Salix). The Poaceae (grass family) is not considered as a climate indicator, because this family is present in every vegetation type. However, Poaceae are often dominant in steppes, so that their abundance, in the absence of trees, may usually be interpreted as a steppe indicator.
Functional types and biomes
At a global scale the major regional groupings of plants, called biomes, are strongly correlated with climate patterns. The distribution area of the main biomes in Europe is shown on the map. The plant functional types are the constituting elements of biomes (see map legend).
Map of the main present biomes in Europe

Map legend and relationship between biomes and plant functional types
Cliquez sur chaque groupe pour afficher la photo correspondante.

Some biomes that existed in the past may have disappeared now. It is the case of the steppe-tundra.

Note. The method presented here was simplified to be of easy use in the Palyno software. But if used with a lot of sampling points and with appropriate statistical analysis, this method allows an accurate vegetation reconstruction and provides palaeovegetation and palaeoclimate maps.


